
How I designed and built this portfolio from scratch using plain HTML and CSS, with no prior web development experience. A four-hour foundations course, version control from day one, and an iterative AI-assisted workflow.
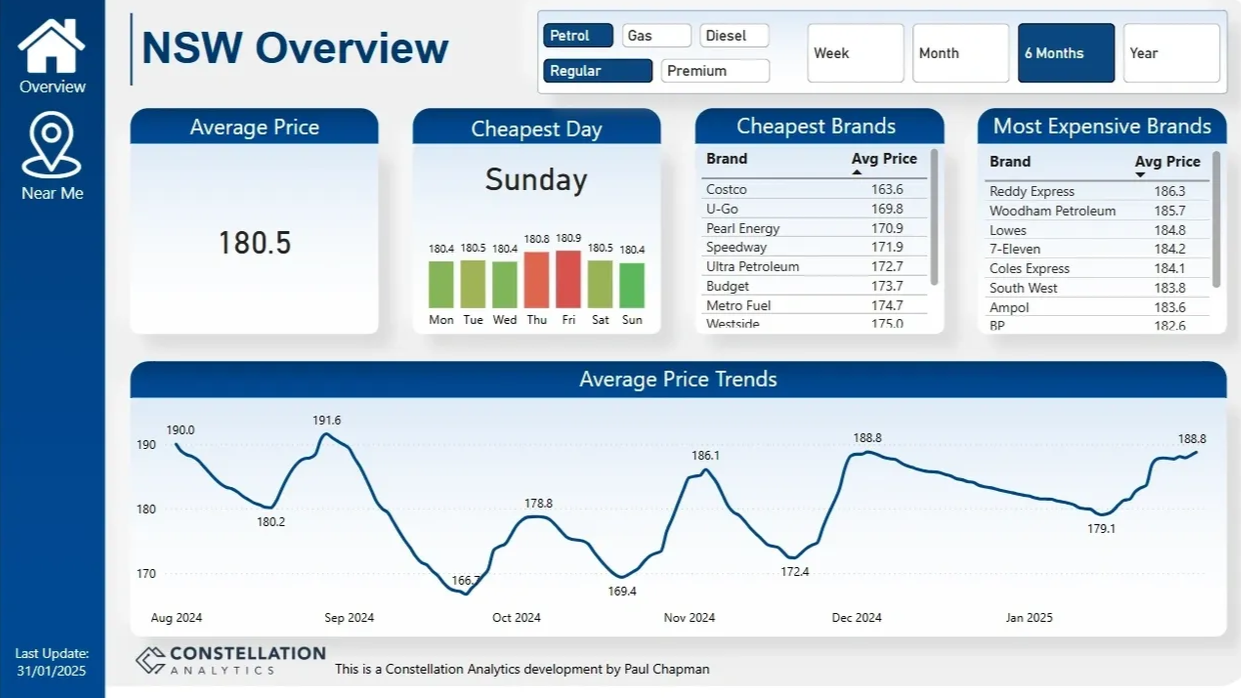
A two-page Power BI dashboard built on a self-managed PostgreSQL pipeline, turning raw NSW FuelCheck data into trend analysis. Includes custom DAX for time period and distance filtering, letting users find the cheapest fuel and the best day to buy.
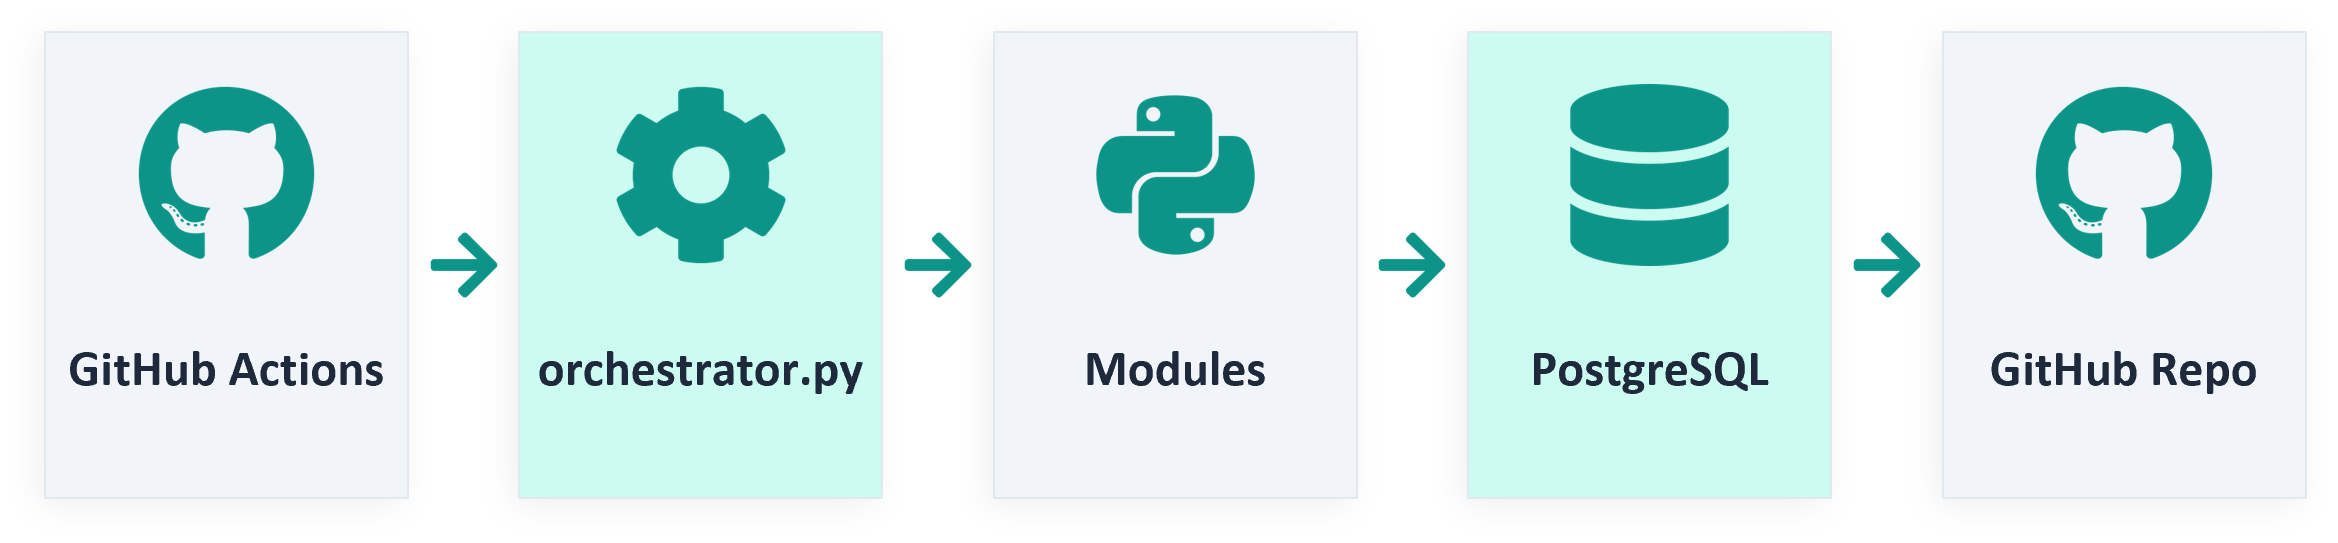
How I replaced a manual monthly process with a fully automated ELT pipeline using GitHub Actions, Neon PostgreSQL, and Python.
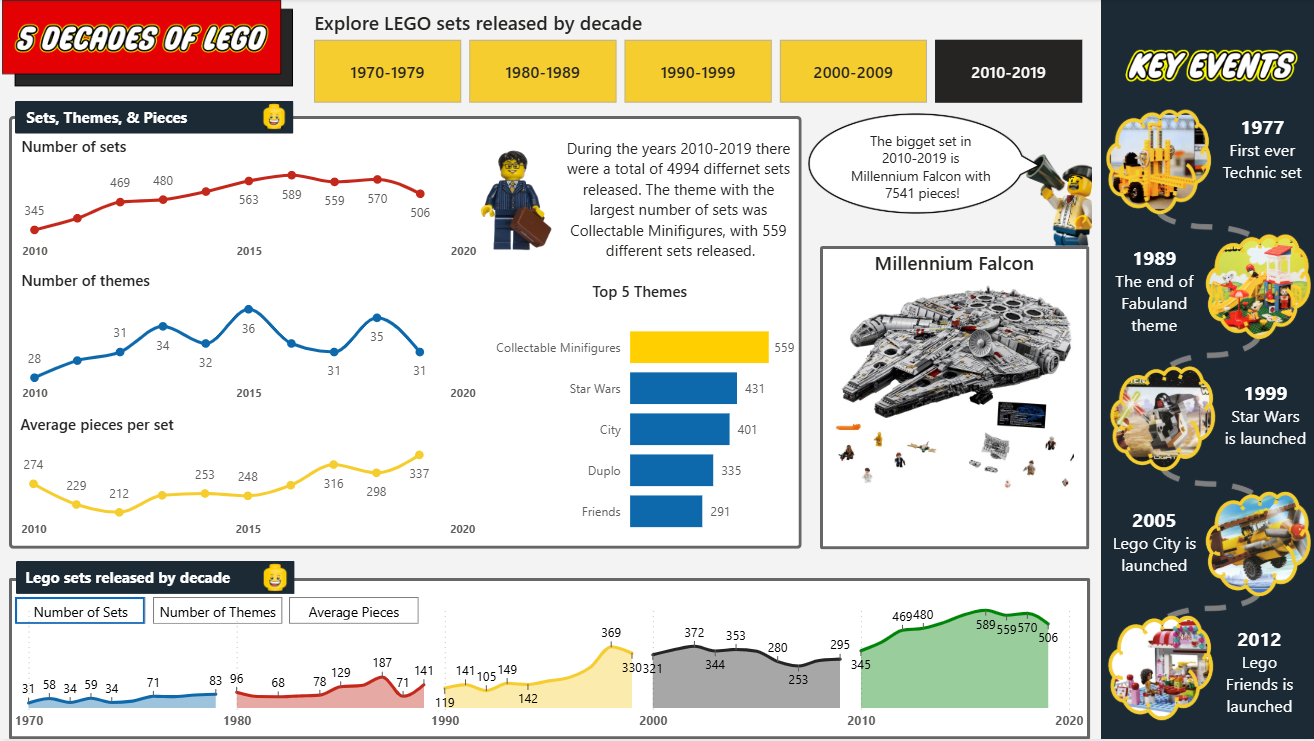
Designed and built an interactive dashboard exploring the history and evolution of LEGO sets over the past five decades, as part of the Maven Analytics 2024 data challenge series.

A three-stage SQL stored procedure pipeline that automates product hierarchy propagation, runs 80+ data quality checks, and produces a full audit trail of every change — replacing a manual Excel-based process for a global energy management company.

As hands on practice for the dbt certification, I built a three-layer dbt model on Neon PostgreSQL, transforming raw Formula One data into reusable and reliable datasets. Built with Python-based incremental loaders and touching all dbt key concepts.